Just want to come back to the shift that BuMet has found in the distribution of temperatures:
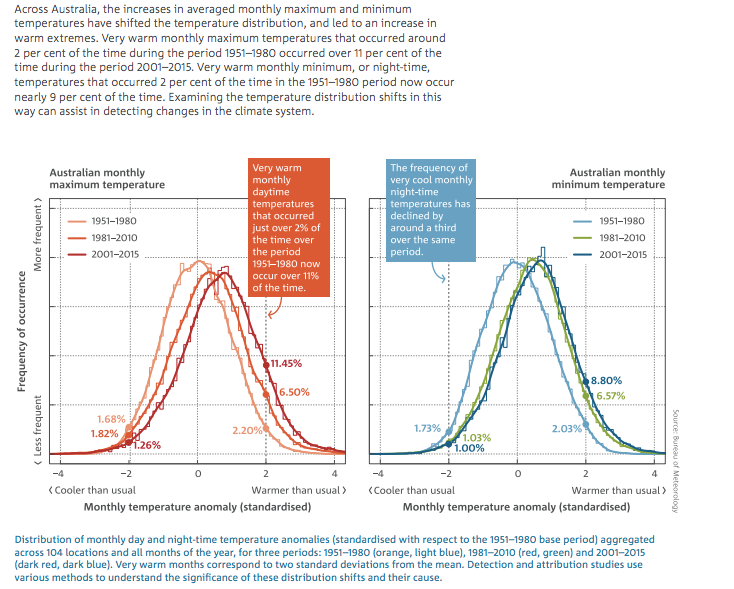
The mean of the maximum temperature distribution has moved to the warm side. That has resulted in, as the notations on the figures show, an increase in the proportion of very hot days from 2% to 11%. Since the world is warming because of AGW that is not a surprising finding. The shift is not happening because the distribution has became more skewed the shift has happened because the distribution of maximum temperatures has moved towards the higher temperature part of the X axis.
Average maximum temperature (the peak of the bell curve) has shifted to the warm side.
Now let us look at the minimum temperature distribution. It has moved even more to the warm side! 1/3 less extreme cold temperatures! The distribution of minimum temperatures has become narrower as we have moved on from the 1950s to 2016. By contrast, the distribution of maximum temperatures has widened (hence the peak of the maximum temperature distributions declined a tad from the peak of the 1951–1980 maximum temperature distribution: the tighter a distribution is the more values are near the mean and so the higher the peak of the distribution.
So, the minimum temperature distribution has less variation (less dispersion, less variance, a smaller standard deviation) so minimum temperatures are more constant between the years. There still is a part of the “tail” of the distribution in the very cold part so some very low minimum temperatures can still happen just more infrequently. So, Booby, if there are cold temperatures here and there in the world they will still be in the minimum temperature distribution, not a sign of an ice age.
The maximum temperature distribution is the opposite, more variance, more chance that maximum temperatures can be hotter or colder than the average.
64 years of reading in total, this is not a short term fluctuation.

 Forum
Forum
 Pages:

 Relationship to the truth (Read 94677 times)


