Jovial Monk wrote on Sep 28
th, 2015 at 10:50pm:
In March, several top climate scientists, including Stefan Rahmstorf of the Potsdam Institute for Climate Impact Research and Michael Mann of Penn State, published a paper in Nature Climate Change suggesting that the gigantic ocean current known as the Atlantic Meridional Overturning Circulation, or AMOC, is weakening. It is sometimes confused with the "Gulf Stream" but, in fact, that is just a southern branch of it.
You do know that study used climate models, don't you? The one I quoted used 2 decades (twenty years) of empirical data. Which to believe data or climate models?
Jovial Monk wrote on Sep 29
th, 2015 at 12:20pm:
Then try to explain why there is a record cold spot at that location. Sealevel rise is an observed phenomenon, not something alleged.
So there is a record cold spot, please point me to some form of proof that it is Greenland melting.
Meanwhile, -
'Greenland's ice sheet appears to be growing faster this winter than in recent years, according to new data from the Danish Meteorological Institute.
This increased rate of ice accumulation follows a virtual standstill in the loss of mass from the huge ice sheet last year that was reported by the National Oceanic and Atmospheric Administration (NOAA) of the US.'
http://www.reportingclimatescience.com/news-stories/article/greenlands-ice-sheet...Sea level rise has been going on since the last Ice Age as ice has melted.
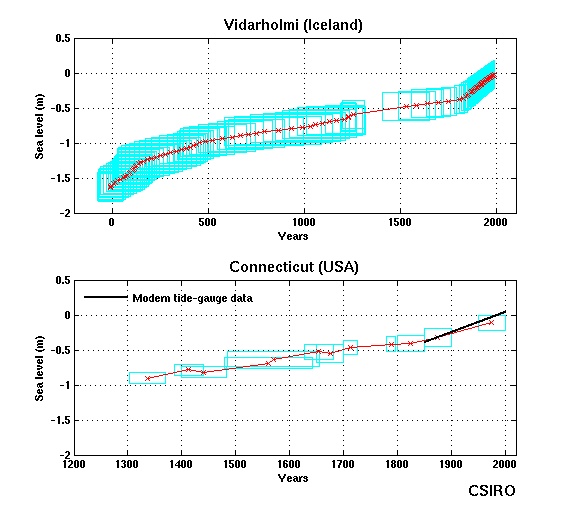
Notice the rate of change in sea level rise at the beginning of the Vidarholmi graph?
Very similar to the last few years.
Or perhaps you prefer NOOA.
'The graphs compare the 95% confidence intervals of relative mean sea level trends for CO-OPS and global stations. Trends with the narrowest confidence intervals are based on the longest data sets. Trends with the widest confidence intervals are based on only 30-40 years of data. The graphs can provide an overarching indication of the differing rates of regional vertical land motion, given that the absolute global sea level rise is believed to be
1.7-1.8 millimeters/year. '
http://tidesandcurrents.noaa.gov/sltrends/globalregional.htmnot really scary is it? About 1/16".

 Forum
Forum
 Pages:


