Forum

 
  Back to OzPolitic.com   Welcome, Guest. Please Login or Register
  Forum Home Album HelpSearch Recent Rules LoginRegister  
 

Pages: 1 ... 15 16 17 18 19 20
Send Topic Print
Signs and consequences of AGW (Read 8230 times)
Jovial Monk
Gold Member
*****
Offline


Dogs not cats!

Posts: 43658
Gender: male
Re: Signs and consequences of AGW
Reply #240 - Jul 21st, 2018 at 7:16am
 
To keep within the Paris Accord 1.5°C limit rapid decarbonisation needs to be carried out. This will be disruptive. Can be done:

https://www.ecofys.com/files/files/ecofys-a-navigant-company-2018-energy-transit...
Back to top
 

Get the vaxx! 💉💉

If you don’t like abortions ignore them like you do school shootings.
 
IP Logged
 
Jovial Monk
Gold Member
*****
Offline


Dogs not cats!

Posts: 43658
Gender: male
Re: Signs and consequences of AGW
Reply #241 - Jul 21st, 2018 at 7:19am
 
Quote:
Kees van der Leun @Sustainable2050 40m40 minutes ago More

Drought in NL: only 12 mm of rain since 1 June, lowest on record, for that period.
Expected rain in the coming week: 0.8 mm. Maybe some more the week after that. https://t.co/lZLfp5XFzS


...
Back to top
 

Get the vaxx! 💉💉

If you don’t like abortions ignore them like you do school shootings.
 
IP Logged
 
Jovial Monk
Gold Member
*****
Offline


Dogs not cats!

Posts: 43658
Gender: male
Re: Signs and consequences of AGW
Reply #242 - Jul 21st, 2018 at 7:19am
 
“Neerslagsom” = sum of precipitation.

Hmmm the De Bilt weatherstation, the one that the liar Dubyne said had omitted 4 high temperature readings. Ha, the fraud had to eat his words on that one.
Back to top
« Last Edit: Jul 21st, 2018 at 7:45am by Jovial Monk »  

Get the vaxx! 💉💉

If you don’t like abortions ignore them like you do school shootings.
 
IP Logged
 
Jovial Monk
Gold Member
*****
Offline


Dogs not cats!

Posts: 43658
Gender: male
Re: Signs and consequences of AGW
Reply #243 - Jul 21st, 2018 at 9:03am
 
Sea level rise following on Antarctic adding net meltwater to the oceans:

Quote:
Expected sea-level rise following Antarctic ice shelves' collapse
Date:
July 19, 2018
Source:
European Geosciences Union

Summary:
Scientists have shown how much sea level would rise if Larsen C and George VI, Antarctic ice shelves at risk of collapse, were to break up. While Larsen C has received much attention due to the break-away of a trillion-ton iceberg from it last summer, its collapse would contribute only a few millimeters to sea-level rise. The break-up of the smaller George VI Ice Shelf would have a much larger impact.

Full Story
Recent, rapid warming in the Antarctic Peninsula is a threat to ice shelves in the region, with Larsen C and George VI considered to have the highest risk of collapse. Because these large ice platforms hold back inland glaciers, the ice carried by these glaciers can flow faster into the sea when the ice shelves collapse, which contributes to sea-level rise. The new study shows that a collapse of Larsen C would result in inland ice discharging about 4 mm to sea level, while the response of glaciers to George VI collapse could contribute over five times more to global sea levels, around 22 mm.

"These numbers, while not enormous in themselves, are only one part of a larger sea-level budget including loss from other glaciers around the world and from the Greenland, East and West Antarctic ice sheets.


https://www.sciencedaily.com/releases/2018/07/180719085424.htm

So Antarctica is adding net ice now and this will increase.

NASA:
...

Quote:
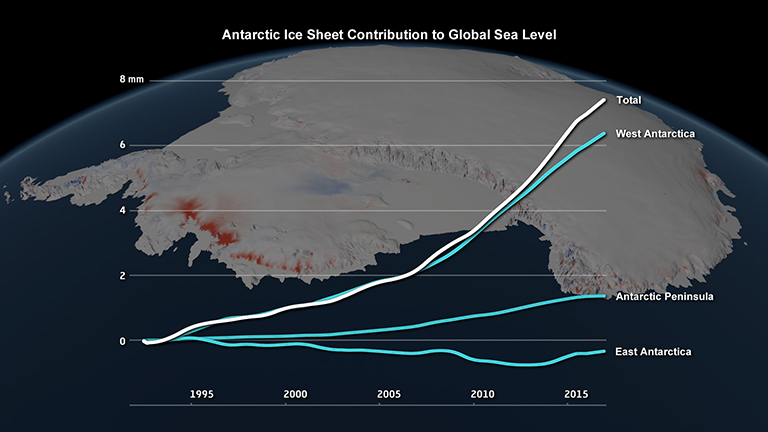
Ice losses from Antarctica have tripled since 2012, increasing global sea levels by 0.12 inch (3 millimeters) in that timeframe alone, according to a major new international climate assessment funded by NASA and ESA (European Space Agency).

According to the study, ice losses from Antarctica are causing sea levels to rise faster today than at any time in the past 25 years. Results of the Ice Sheet Mass Balance Inter-comparison Exercise (IMBIE) were published Wednesday in the journal Nature.

The late summer sun sets over mountains and icebergs around Adelaide Island, Antarctic Peninsula, as 24-hour daylight gives way to the long polar night of winter.
The late summer sun sets over mountains and icebergs around Adelaide Island, Antarctic Peninsula, as 24-hour daylight gives way to the long polar night of winter. Credit: BAS/Hamish Pritchard
“This is the most robust study of the ice mass balance of Antarctica to date,” said assessment team co-lead Erik Ivins at NASA’s Jet Propulsion Laboratory (JPL). “It covers a longer period than our 2012 IMBIE study, has a larger pool of participants, and incorporates refinements in our observing capability and an improved ability to assess uncertainties.”

This latest IMBIE is the most complete assessment of Antarctic ice mass changes to date, combining 24 satellite surveys of Antarctica and involving 80 scientists from 42 international organizations.

The Antarctic Peninsula from the air: although the mountains are plastered in snow and ice, measurements tell us that this region is losing ice at an increasing rate.
The Antarctic Peninsula from the air: although the mountains are plastered in snow and ice, measurements tell us that this region is losing ice at an increasing rate. Credit: University of Durham/Pippa Whitehouse
The team looked at the mass balance of the Antarctic ice sheet from 1992 to 2017 and found ice losses from Antarctica raised global sea levels by 0.3 inches (7.6 millimeters), with a sharp uptick in ice loss in recent years. They attribute the threefold increase in ice loss from the continent since 2012 to a combination of increased rates of ice melt in West Antarctica and the Antarctic Peninsula, and reduced growth of the East Antarctic ice sheet.

Prior to 2012, ice was lost at a steady rate of about 83.8 billion tons (76 billion metric tons) per year, contributing about 0.008 inches (0.2 millimeters) a year to sea level rise. Since 2012, the amount of ice loss per year has tripled to 241.4 billion tons (219 billion metric tonnes) – equivalent to about 0.02 inches per year (0.6 millimeters) of sea level rise.

Crevasses near the grounding line of Pine Island Glacier, Antarctica.
Crevasses near the grounding line of Pine Island Glacier, Antarctica. Credit: University of Washington/I. Joughin
West Antarctica experienced the greatest recent change, with ice loss rising from 58.4 billion tons (53 billion metric tons) per year in the 1990s, to 175.3 billion tons (159 billion metric tons) a year since 2012. Most of this loss came from the huge Pine Island and Thwaites Glaciers, which are retreating rapidly due to ocean-induced melting.

At the northern tip of the continent, ice-shelf collapse at the Antarctic Peninsula has driven an increase of 27.6 billion tons (25 billion metric tons) in ice loss per year since the early 2000s. Meanwhile, the team found the East Antarctic ice sheet has remained relatively balanced during the past 25 years, gaining an average of 5.5 billion tons (5 billion metric tons) of ice per year.


https://sealevel.nasa.gov/news/129/ramp-up-in-antarctic-ice-loss-speeds-sea-leve...

Back to top
 

Get the vaxx! 💉💉

If you don’t like abortions ignore them like you do school shootings.
 
IP Logged
 
Jovial Monk
Gold Member
*****
Offline


Dogs not cats!

Posts: 43658
Gender: male
Re: Signs and consequences of AGW
Reply #244 - Jul 21st, 2018 at 9:04am
 
So sea level rise and the flooding that is a consequence of the SLR will be an obvious and visible indication that AGW has not gone away and must be tackled as a serious challenge to our safety.
Back to top
 

Get the vaxx! 💉💉

If you don’t like abortions ignore them like you do school shootings.
 
IP Logged
 
Jovial Monk
Gold Member
*****
Offline


Dogs not cats!

Posts: 43658
Gender: male
Re: Signs and consequences of AGW
Reply #245 - Jul 21st, 2018 at 10:15am
 
Some good blogs on AGW:

RobertScribbler—robertscribbler.com

A Dutch blog—Google will translate, never fear: https://klimaatverandering.wordpress.com/[url][/url]

klimaatverandering = climate + changing = climate change.

There is a blog on the book “The Madhouse Effect” at:
https://klimaatverandering.wordpress.com/2018/07/19/the-madhouse-effect/

Just ordered a copy of “The Madhouse Effect.” $26 incl postage.
Back to top
« Last Edit: Jul 21st, 2018 at 10:43am by Jovial Monk »  

Get the vaxx! 💉💉

If you don’t like abortions ignore them like you do school shootings.
 
IP Logged
 
lee
Gold Member
*****
Offline


Australian Politics

Posts: 16438
Gender: male
Re: Signs and consequences of AGW
Reply #246 - Jul 21st, 2018 at 2:19pm
 
Aussie wrote on Jul 20th, 2018 at 9:31pm:
No idea, and don't care.


Yeah. Aussie the no idea man. But still raises his head to sprout about AGW. He conatantly seems to want to prove hi "no idea"- ness.

Aussie wrote on Jul 20th, 2018 at 9:31pm:
This Coleman is just a hack TV presenter, nothing more.


"Coleman obtained Professional membership status in the American Meteorological Society and was named AMS Broadcast Meteorologist of the Year in 1983."

Source: wiki.

Seems the AMS thought he was more than OK until he disagreed with them.

But how about "estranged"? What a funny word to use. Michael Mann - been called "fraud", and yet the greatest epithet they can lay on him is "estranged". Like having your credentials being burnished by gossamer wings.

You are just too funny.
Back to top
« Last Edit: Jul 21st, 2018 at 3:51pm by Mod. »  
 
IP Logged
 
lee
Gold Member
*****
Offline


Australian Politics

Posts: 16438
Gender: male
Re: Signs and consequences of AGW
Reply #247 - Jul 21st, 2018 at 2:49pm
 
Jovial Monk wrote on Jul 21st, 2018 at 7:16am:
To keep within the Paris Accord 1.5°C limit rapid decarbonisation needs to be carried out. This will be disruptive. Can be done:

https://www.ecofys.com/files/files/ecofys-a-navigant-company-2018-energy-transit...


Depending of course if China reduces its emissions. How is that going?

"China’s carbon emissions are projected to grow by 3.5% in 2017, ending a trend that has seen emissions plateau for the past three years globally, according to a new study launched at the UN climate talks in Bonn.

Although China has set ambitious targets to curb coal consumption and move toward a sustainable model of development, it continues to promote heavy industry as a means of boosting economic growth when GDP threatens to fall too fast.

The rise in China’s emissions is caused by greater coal consumption following fresh stimulus to infrastructure, concentrated in the steel and cement sectors, found the study by Global Carbon Project. "

https://www.chinadialogue.net/article/show/single/en/10212-China-s-carbon-emissi...

"n 2017, China emitted 11.7 billion metric tons of heat-trapping gases, a quarter of the world’s total. That included 9.2 billion metric tons of carbon dioxide, the gas most responsible for accelerated climate change, more than the total for the United States and the European Union combined."

https://www.nytimes.com/2018/07/19/world/asia/china-climate-change-report.html
Back to top
 
 
IP Logged
 
Aussie
Gold Member
*****
Offline


OzPolitic

Posts: 37678
Gender: male
Re: Signs and consequences of AGW
Reply #248 - Jul 21st, 2018 at 2:57pm
 
Quote:
Yeah. Aussie the no idea man. But still raises his head to sprout about AGW. He conatantly seems to want to prove hi "no idea"- ness.


Like Hell I do.  I know nothing about AGW and am not constantly raising my head to sprout about it. 

What say ye about Gina being a major donor to a Mob which denies AGW?

Link.

Quote:
Australia’s richest person, mining magnate Gina Rinehart, has been revealed as a key funder of the right wing think tank the Institute of Public Affairs (IPA) — a major pusher of climate science denial.

Rinehart’s company, Hancock Prospecting Proprietary Ltd (HPPL), donated $2.3 million to the IPA in 2016 and $2.2 million in 2017, according to disclosures made to the New South Wales Supreme Court.


Back to top
 
 
IP Logged
 
lee
Gold Member
*****
Offline


Australian Politics

Posts: 16438
Gender: male
Re: Signs and consequences of AGW
Reply #249 - Jul 21st, 2018 at 3:11pm
 
Jovial Monk wrote on Jul 21st, 2018 at 9:03am:
According to the study, ice losses from Antarctica are causing sea levels to rise faster today than at any time in the past 25 years. Results of the Ice Sheet Mass Balance Inter-comparison Exercise (IMBIE) were published Wednesday in the journal Nature.


"The improvements were achieved through combination of ice sheet imbalance estimates developed from the independent satellite techniques of altimetry, gravimetry and the input-output method. "

http://imbie.org/about-the-project/

So still using the satellite altimeter, GRACE gravity data - with its flaws and an input-output method? Grin Grin

Jovial Monk wrote on Jul 21st, 2018 at 9:03am:
So Antarctica is adding net ice now and this will increase.


But you have been saying net ice is decreasing.

Jovial Monk wrote on Jul 21st, 2018 at 9:03am:
Sea level rise following on Antarctic adding net meltwater to the oceans:


" According to the simulations presented in the new The Cryosphere study, adjustment of the glaciers flowing into it following a collapse could contribute up to 8 mm to global sea levels by 2100 and 22 mm by 2300."

https://www.egu.eu/news/416/new-study-puts-a-figure-on-sea-level-rise-following-...

Still love your models I see JM.  I notice they didn't specify their input parameters.

Is the Chukchi Sea ice free yet? Umm - No

"The ice edge has changed little within the Barents and East Greenland Seas on the Atlantic side, and retreat has been sluggish in the Chukchi Sea on the Pacific side of the Arctic Ocean."

https://nsidc.org/arcticseaicenews/

It wasn't Robert Scribbler who told you it had disappeared, was it?
Back to top
« Last Edit: Jul 21st, 2018 at 3:51pm by Mod. »  
 
IP Logged
 
lee
Gold Member
*****
Offline


Australian Politics

Posts: 16438
Gender: male
Re: Signs and consequences of AGW
Reply #250 - Jul 21st, 2018 at 3:16pm
 
Aussie wrote on Jul 21st, 2018 at 2:57pm:
What say ye about Gina being a major donor to a Mob which denies AGW?


Gina can donate her money to whomsoever she wishes.

Do they deny AGW? Catastrophic AGW  or something else?

Oh, "Climate Science denial". Yes well there is a lot of "Climate Science" that is not.

Back to top
« Last Edit: Jul 21st, 2018 at 3:50pm by Mod. »  
 
IP Logged
 
Jovial Monk
Gold Member
*****
Offline


Dogs not cats!

Posts: 43658
Gender: male
Re: Signs and consequences of AGW
Reply #251 - Jul 21st, 2018 at 3:50pm
 
We know things we can do:

Move to electric vehicles. Cars, electric-assisted semitrailers, trolleybuses. The latter, way cheaper than trams, only need overhead power lines, don’t need rails (+sleepers + ballast)

Energy efficiency, better design rules for buildings.

Renewable energy, phasing out fossil fuel energy sources. Need very high voltage DC network and storage options. All this is possible.

Removing CO2 from the atmosphere, mass planting and harvesting of bamboo, putting this in permanent form in floorboards etc. Chemical engineering ways.

Still need to adapt and mitigate tho—huge systems, lots of momentum.
Back to top
 

Get the vaxx! 💉💉

If you don’t like abortions ignore them like you do school shootings.
 
IP Logged
 
lee
Gold Member
*****
Offline


Australian Politics

Posts: 16438
Gender: male
Re: Signs and consequences of AGW
Reply #252 - Jul 21st, 2018 at 4:31pm
 
Jovial Monk wrote on Jul 21st, 2018 at 3:50pm:
We know things we can do:


Yes. What will the impact be?

Jovial Monk wrote on Jul 21st, 2018 at 3:50pm:
Move to electric vehicles. Cars, electric-assisted semitrailers, trolleybuses. The latter, way cheaper than trams, only need overhead power lines, don’t need rails (+sleepers + ballast)


Yes. I can see freight moving on these vehicle stopping every four hours for recharge.

But apparently we don't need no stinkin' baseload power for recharge.
Back to top
« Last Edit: Jul 21st, 2018 at 4:41pm by Mod. »  
 
IP Logged
 
Bobby.
Gold Member
*****
Offline


Australian Politics

Posts: 95522
Melbourne
Gender: male
Re: Signs and consequences of AGW
Reply #253 - Jul 22nd, 2018 at 3:06pm
 
President Elect, The Mechanic wrote on Jul 22nd, 2018 at 2:28pm:
Record Cold Australia With Huge Snowfall & Japan Mega-Flood Update


Thanks Mechanic,
I hope Monk watches that:


Adapt 2030
Published on Jul 21, 2018

Australia smashing all time cold records throughout the east coast. While not the coldest winter across the entire country, extreme cold and coldest in 60 years with huge snowfalls that have officially opened all ski resorts in Australia. Forecasters called above temperatures in May, but now this Australian super-freeze 2.0 has left them silent. Japan still in chaos as once in 1000 year floods decimated the lower half of the entire country and now summer temperatures are getting into the normally warmest part of the year Late July / August in the Pacific.
Back to top
 
 
IP Logged
 
Aussie
Gold Member
*****
Offline


OzPolitic

Posts: 37678
Gender: male
Re: Signs and consequences of AGW
Reply #254 - Jul 22nd, 2018 at 3:28pm
 
I watched it Bobby.  It is typical of the snake oil man's slick and misleading presentation.

He does this all the time.  There will be some isolated part of Australia where there was a record cold, and he refers to that as being the entire east coast of Australia.

Snow falls at resorts?  Gee, I wonder if the source of that was the resort owners who want their potential customers to go there.

Stop buying his crap, Bobby.

Back to top
 
 
IP Logged
 
Pages: 1 ... 15 16 17 18 19 20
Send Topic Print