Emma wrote on Mar 20
th, 2013 at 11:50pm:
SO
THE STATS ARE IN..
all you anal retentives who want the facts... the facts are in.
Hottest ever...!! for simplification purposes.

And now you fearful deniers will say... BUT BUT BUT what about before records were kept.?? What about it?
You have speculation only.. you'd rather rely on .. but.. maybe .. than on recorded history.
What a fanciful idea... that there was a similar time in the past.


Er what civilisation WAS that??
It just doesn't make it as a reasonable argument, and you'll just have to admit that it has been the hottest ever yr...
tough ,
and times are going to get tougher again.

and I am still waiting to hear what exactly UAH Satellites are,.. and why , how , they have some say.???
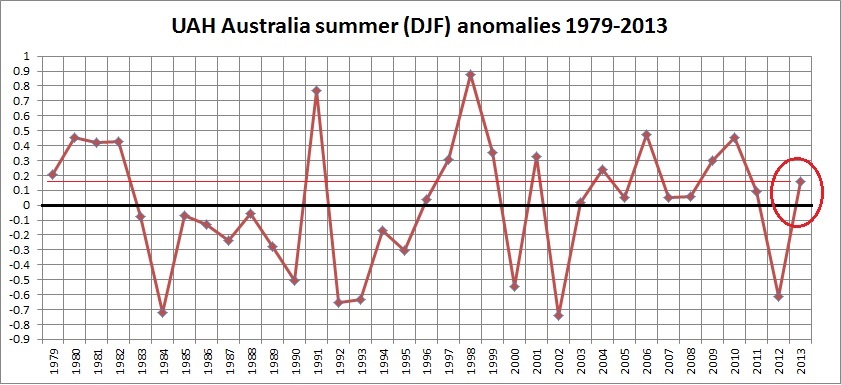
The record heat was cause by UHI and poor station location (for BOM). Satelite data says it was not the hottest and that is the most reliable consider there is no poor station location but still has the UHI signiture.
The satellite data shows that the summer of 2012-2013 was close to ordinary, compared with the entire satellite record going back to 1979. Not a record. Not even extreme?

The graph data comes thanks to John Christy, Director, Earth System Science Center, Distinguished Professor, Atmospheric Science
University of Alabama in Huntsville, Alabama State Climatologist and Roy Spencer. It was graphed by Ken Stewart at KensKingdom, and inspired by Tom Quirk at Quadrant. I was very happy to connect them this weekend. The data cover “average lower troposphere temperature anomalies for land grids only for the region 10S-40S by 110E-155E.” UPDATE: The data in the graph above does include Tasmania as well, and does not include PNG or Timor.

 Forum
Forum

 Home
Home 

 Album
Album 

 Help
Help

 Search

 Recent

 Rules
Rules 

 Login
Login

 Register


 Pages:

