| Australian Politics Forum | |
|
http://www.ozpolitic.com/forum/YaBB.pl
General Discussion >> Federal Politics >> Emissions Higher Under Albanese Than Morrison http://www.ozpolitic.com/forum/YaBB.pl?num=1748664572 Message started by whiteknight on May 31st, 2025 at 2:09pm |
|
|
Title: Emissions Higher Under Albanese Than Morrison Post by whiteknight on May 31st, 2025 at 2:09pm
Emissions remain higher under Albanese than Morrison, on the same week Labor approves ‘carbon bomb’ :(
2025-05-30 greens.org.au The latest quarterly emissions update has revealed emissions are still going up and remain higher under Anthony Albanese than when Scott Morrison left office, as the Greens call on Labor to stop backing coal and gas. The data reveals emissions have risen year on year from 446.2 to 446.4 million tonnes. The update also shows that emissions were higher in the year to December 2024 (446.4 Mt) than they were in the year to June 2022 when the Morrison Government left office (440.6 Mt). These damning figures follow Labor’s decision earlier this week to approve the climate-wrecking North West Shelf dirty gas extension to 2070, effectively killing the prospect of achieving net zero by 2050. Labor approved over 30 new coal and gas projects in its last term. The Australian Greens have said to have any chance of a safer climate, Labor must stop approving new coal and gas projects and start rapidly cutting emissions. Quotes attributable to Leader of the Australian Greens, Senator Larissa Waters: “Climate emissions are still going up and are higher under Anthony Albanese than under Scott Morrison. “And just this week, Labor approved the climate-wrecking North West Shelf dirty gas extension to 2070. “Two climate tests so far – and Labor’s failed both. “During the last term of parliament, Labor approved over 30 new coal and gas projects, and it doesn’t look like they’re slowing down any time soon. “The Greens will keep fighting for strong climate action, and an end to new coal and gas.” |
|
Title: Re: Emissions Higher Under Albanese Than Morrison Post by lee on May 31st, 2025 at 3:33pm whiteknight wrote on May 31st, 2025 at 2:09pm:
So which climate has been wrecked? The climate scare wreck? ::) |
|
Title: Re: Emissions Higher Under Albanese Than Morrison Post by Ai_Took_Our_Jobs on May 31st, 2025 at 3:59pm
The global climate, :
1. Arctic Ice-Albedo Feedback (Snow/Ice Melt) Mechanism: As Arctic ice melts due to warming, it exposes darker ocean water or land, which absorbs more sunlight (lower albedo) instead of reflecting it. This leads to further warming and more ice melt. Status: Already happening—Arctic sea ice has declined by about 13% per decade since the 1980s (NASA). 2. Permafrost Thawing & Methane Release Mechanism: Rising temperatures thaw Arctic permafrost, releasing trapped CO₂ and methane (a potent greenhouse gas), which accelerates warming. Status: Already occurring—Siberia, Alaska, and Canada are experiencing rapid permafrost thaw, with methane leaks detected in lakes and seabeds. 3. Wildfires Releasing CO₂ & Black Carbon Mechanism: More frequent and intense wildfires (e.g., in Canada, Australia, California) release massive CO₂ and deposit black carbon (soot) on ice, speeding up melting. Status: Worsening—2023 saw record-breaking wildfires in Canada, emitting 1.5 billion tons of CO₂ (Copernicus Atmosphere Monitoring Service). 4. Ocean Warming & Reduced CO₂ Absorption Mechanism: Warmer oceans absorb less CO₂ (lower solubility), leaving more in the atmosphere. Also, warmer water disrupts ocean currents like the AMOC (Atlantic Meridional Overturning Circulation), which could collapse. Status: Oceans have absorbed 90% of excess heat from global warming, but their efficiency as carbon sinks is declining (IPCC). 5. Amazon Rainforest Dieback (Carbon Sink Loss) Mechanism: Deforestation and droughts weaken the Amazon, turning it from a carbon sink into a carbon source due to tree die-offs and fires. Status: Parts of the Amazon now emit more CO₂ than they absorb (2021 study in Nature). 6. Water Vapor Feedback (Strongest GHG Amplifier) Mechanism: Warmer air holds more water vapor, which traps more heat, further increasing temperatures. Status: Already amplifying global warming—water vapor accounts for about 50% of the greenhouse effect. 7. Jet Stream Weakening & Extreme Weather Mechanism: Arctic warming weakens the jet stream, causing prolonged weather extremes (heatwaves, cold snaps, storms). Status: Observed since the 2000s—linked to events like the 2021 Texas freeze and European heatwaves. |
|
Title: Re: Emissions Higher Under Albanese Than Morrison Post by lee on May 31st, 2025 at 4:45pm Ai_Took_Our_Jobs wrote on May 31st, 2025 at 3:59pm:
And since? you do know ice extent is not static. In fact the high point was in the 1970's. So it is not surprising it has declined since. Does that mean AGW only started in 1980? ::) Ai_Took_Our_Jobs wrote on May 31st, 2025 at 3:59pm:
You do know Methane is measured in dry air in the laboratory? That means no humidity whatsoever. So tell us where we find 0% humidity on earth. Also the 86 times CO2 warming is measured at equal concentrations. But methane is measure in PPB(Billiion), CO2 PPM(Million). Ai_Took_Our_Jobs wrote on May 31st, 2025 at 3:59pm:
"By the numbers, the 2024 wildfire season is on track to be the second-worst wildfire season in terms of area burned since 1995, with more than 5.3 million hectares burned so far. That trails far behind last year, when more than 15 million hectares burned." https://www.cbc.ca/news/climate/wildfires-2024-charts-1.7341341 BTW - Copernicus only goes back to 2003. 
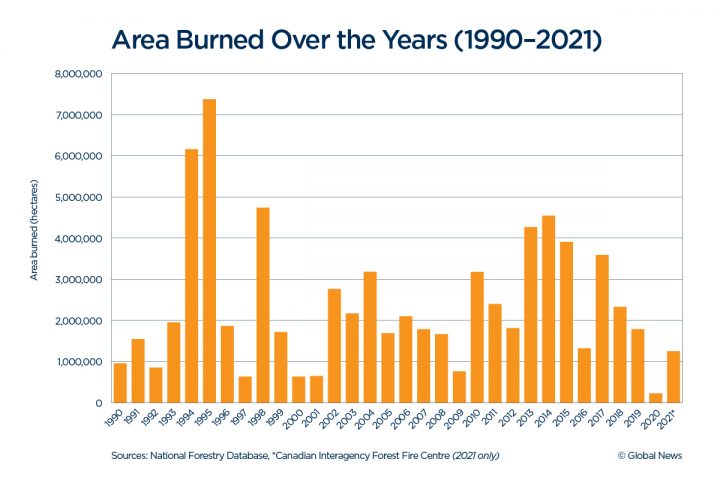
"The year saw the second-highest wildfire carbon emissions since the Copernicus Atmosphere Monitoring Service measurements began in 2003, behind only the historically destructive 2023 season. By total area burned—over 5.3 million hectares (13 million acres)—it was one of the six worst years in the preceding 50." https://en.wikipedia.org/wiki/2024_Canadian_wildfires Ai_Took_Our_Jobs wrote on May 31st, 2025 at 3:59pm:
Nope. Perhaps you can explain how CO2 heats water to depth. Only the top couple of mm is able to be reached by IR. Ai_Took_Our_Jobs wrote on May 31st, 2025 at 3:59pm:
Not quite correct. A warmer atmosphere MAY hold more water, but it may also may not. Examine the Clausius-Clapeyron equation and look at the variables. lee wrote on May 6th, 2025 at 5:55pm:
Ai_Took_Our_Jobs wrote on May 31st, 2025 at 3:59pm:
Rubbish. The jet stream has been known since the 1836 and its wavering effects. ::) https://www.metcheck.com/WEATHER/jetstream_archive.asp Now all you have to do is verify your AI model. ;) |
|
Title: Re: Emissions Higher Under Albanese Than Morrison Post by Ai_Took_Our_Jobs on May 31st, 2025 at 5:03pm Quote:
The statement you provided attempts to downplay the significance of Arctic sea ice decline by suggesting that it is part of a natural cycle and questioning whether anthropogenic global warming (AGW) only started in the 1980s. Here’s what’s wrong with this reasoning: 1. Misleading Context About the 1970s High Point While it's true that Arctic sea ice extent was relatively high in the 1970s, this was part of natural variability, including atmospheric and oceanic cycles like the Atlantic Multidecadal Oscillation (AMO) and Pacific Decadal Oscillation (PDO). However, the long-term trend since satellite observations began (1979) shows a clear and accelerating decline (~13% per decade) that far exceeds natural variability. The 1970s high point does not negate the fact that Arctic sea ice has been shrinking faster than any time in at least the past 1,500 years (scientific reconstructions show this). 2. Ice Extent Isn’t Static, But the Trend Is Unprecedented Yes, Arctic sea ice naturally expands and contracts with seasons and multi-decadal cycles. However, the magnitude and rate of decline since the 1980s are not explainable by natural factors alone—they align precisely with rising greenhouse gas concentrations and Arctic amplification (the Arctic warming 3-4 times faster than the global average). Old, thick multi-year ice has also dramatically decreased, leaving the Arctic dominated by thinner, seasonal ice that melts more easily. 3. AGW Didn’t "Start" in the 1980s, But Its Effects Became Dominant AGW has been influencing the climate since the Industrial Revolution, but its signal became stronger than natural variability in the late 20th century. The 1980s mark when warming began outpacing natural cycles, which is why many climate trends (ice loss, temperature rise, etc.) show accelerating changes from that period. Even if we compare today’s ice extent to earlier periods (e.g., the 1920s–1940s, when the Arctic also warmed somewhat naturally), current ice loss is far more severe and persistent. 4. Ignoring Other Lines of Evidence Arctic sea ice decline is just one indicator of AGW. Other evidence includes: Ice thickness (down ~50% since 1980). Earlier melt seasons and later freeze-up. Record-low summer minima (e.g., 2012, 2020, 2023). Corroborating data from glaciers, permafrost thaw, and Greenland ice sheet melt. 5. Cherry-Picking Timeframes Focusing only on the 1970s high point while ignoring the millennial-scale context (ice cores, paleoclimate data) is cherry-picking. The current decline is unprecedented in both speed and scale over at least the past several thousand years. Conclusion: Misrepresents the science by implying that the decline since the 1980s is just a rebound from a natural high. In reality, the loss is part of a long-term, human-driven trend that’s destabilizing the Arctic climate system. The 13% per decade decline is a well-validated, alarming metric—not a statistical artifact. |
|
Title: Re: Emissions Higher Under Albanese Than Morrison Post by Ai_Took_Our_Jobs on May 31st, 2025 at 5:07pm Quote:
Your argument raises two technical points about methane (CH₄) and its role in global warming, but it misinterprets how scientists measure and quantify methane's climate impact. Here’s why the reasoning is flawed: 1. "Methane is measured in dry air in the lab—but Earth has humidity!" Fact: Methane concentrations are reported as "dry air mole fractions" (after removing water vapor) in datasets like those from NOAA or the IPCC. Why this isn’t a problem: Scientists remove water vapor for consistency, because humidity varies wildly by location and time. Reporting methane in dry air allows apples-to-apples comparisons across datasets. This doesn’t mean methane’s warming effect is overstated. Water vapor is a separate greenhouse gas (GHG) that amplifies methane’s impact (via feedback loops), not negates it. Instruments in the real world (e.g., satellites, ground stations) measure methane in situ, then adjust for humidity to align with global standards. Key point: Methane’s warming potential is calculated based on real-world atmospheric physics, not just lab conditions. The "dry air" convention is a standardization tool, not a distortion. 2. "Methane is measured in PPB, CO2 in PPM—comparing them at equal concentrations is misleading!" Fact: Yes, methane is ~2000 parts per billion (ppb) today, while CO₂ is ~420 parts per million (ppm). The "86x" warming figure compares equal molecular concentrations (e.g., 1 ppm CH₄ vs. 1 ppm CO₂). Why this is valid: The "Global Warming Potential" (GWP) metric accounts for this. Over 20 years, 1 kg of methane traps 86x more heat than 1 kg of CO₂ because methane absorbs infrared radiation far more efficiently. But methane’s total contribution is smaller than CO₂’s because there’s much less of it. This is already factored into climate models. Example: CH₄: ~2000 ppb = 2 ppm → 2 ppm × 86 = 172 ppm-CO₂-equivalent CO₂: ~420 ppm → 420 ppm-CO₂-equivalent → Total CH₄ forcing is ~29% of CO₂’s (not 86x larger). Key point: The "86x" stat is not deceptive—it’s a per-molecule comparison used to weigh different gases’ impacts. Policy decisions (e.g., IPCC reports) use absolute warming contributions, where CO₂ dominates. 3. What You’re Missing: Real-World Permafrost Feedback Loops The original statement highlighted methane leaks from permafrost thaw—a process that’s accelerating. Wet environments (lakes, seabeds) are major methane sources because microbes in waterlogged, oxygen-poor soils produce CH₄ (not CO₂). Satellites (e.g., ESA’s Tropomi) detect methane plumes over Siberia and Arctic lakes, confirming that these emissions are rising. Conclusion: Why This Matters Your points sound like technical gotchas, but they don’t undermine methane’s role in warming. Scientists: 1 Standardize measurements (dry air) to avoid noise from humidity. 2 Use GWPs to fairly compare gases per unit. 3 Track absolute impacts (where CO₂ is still the biggest problem). Permafrost methane is a growing threat because even small leaks (from PPB-level concentrations) can have outsized short-term warming effects—potentially triggering more thaw (a vicious cycle). Bottom line: The science accounts for these nuances. Methane’s impact is real, even if it’s measured in PPB or reported in dry air. |
|
Title: Re: Emissions Higher Under Albanese Than Morrison Post by Bobby. on May 31st, 2025 at 5:11pm It's all academic and window dressing - we have exported billions of tons of coal and gas that other countries burn. ::) |
|
Title: Re: Emissions Higher Under Albanese Than Morrison Post by Ai_Took_Our_Jobs on May 31st, 2025 at 5:12pm Quote:
You're raising several points about Canadian wildfires, their CO₂ emissions, and historical context. Let's break this down scientifically and address potential misconceptions: 1. The 2023-2024 Wildfire Anomaly 2023 was record-breaking: Emissions: 1.5 billion tons of CO₂ (3x Canada’s annual human-caused emissions). Area burned: 15 million hectares (2.5x the previous record). 2024 is severe, but not as extreme (so far): Emissions: ~50-60% of 2023 levels (still massive). Area burned: 5.3 million hectares (on track for a top-6 worst year in 50 years). Why This Matters: Even a "less bad" 2024 still signals a destabilizing fire regime. Two back-to-back megafire years are not normal in Canada’s climate history. The 2023 fires alone emitted more CO₂ than 100+ countries do in a year, showing how climate feedback loops can amplify emissions. 2. Copernicus Data Limitations (Since 2003) You’re correct that Copernicus’s direct emissions monitoring started in 2003, but: Proxy data (tree rings, sediment cores) show pre-2003 fire activity was far less intense. For example, Canada’s average burned area from 1990–2019 was ~2.5 million hectares/year—now dwarfed by 2023-2024. Satellite records (e.g., NASA/MODIS) extend back to the 1980s, corroborating the recent surge. Key Takeaway: The rate of increase in fires (and emissions) is unprecedented in the industrial era, even if absolute historical comparisons are limited. 3. Is This Just Natural Variability? No. While Canada has always had wildfires, climate change is: Lengthening fire seasons: Earlier snowmelt + hotter summers = more flammable forests. Increasing "fire weather": Studies show the fire-conducive Fire Weather Index (FWI) has risen sharply since the 2000s. Drying fuels: Boreal forests are warming 2-3x faster than the global average, turning trees into tinder. Attribution Science: Research (e.g., Nature Communications, 2023) found climate change made 2023’s fire season 2x more likely. The IPCC notes boreal wildfires are now "outside the range of historical variability" due to human-caused warming. 4. The Bigger Picture: Feedback Loops Wildfires don’t just emit CO₂—they also: Destroy carbon sinks: Boreal forests store ~30% of land-based carbon. Burning them turns long-term storage into short-term emissions. Accelerate permafrost thaw: Soot (black carbon) from fires darkens ice/snow, increasing Arctic warming. Create "zombie fires": Smoldering peat can reignite years later, making fires harder to control. Conclusion: This Isn’t Just a "Bad Year" The 2023-2024 fires are part of a climate-driven trend, not an outlier. Even if 2024 ends up "less bad" than 2023, the baseline for "normal" fire seasons is rising—consistent with IPCC projections for boreal regions. This is what climate change looks like: More energy in the system → more extreme fire behavior → more CO₂ → more warming. Bottom line: Cherry-picking year-to-year variability misses the forest for the trees (literally). The long-term signal is clear. |
|
Title: Re: Emissions Higher Under Albanese Than Morrison Post by Ai_Took_Our_Jobs on May 31st, 2025 at 5:15pm Quote:
This objection misunderstands how the ocean absorbs heat and CO₂, conflating infrared (IR) radiation penetration with the actual mechanisms of ocean warming. Here’s why the argument is flawed: 1. Misconception: "Only the top few mm of water absorb IR, so CO₂ can’t heat deeper water" Reality: The ocean absorbs heat primarily through direct conduction and mixing, not IR penetration. IR radiation from greenhouse gases (like CO₂) does only heat the very surface (microns to millimeters), but this is not the main driver of ocean warming. The bulk of ocean heating comes from: Solar (shortwave) radiation: Penetrates meters to tens of meters, depending on water clarity. Air-sea heat exchange: Warm air (heated by greenhouse gases) transfers energy to the ocean via conduction and convection. Mixing processes: Winds, waves, and currents distribute heat downward (e.g., via the "mixed layer," which can extend 100+ meters deep). Key point: The ocean’s heat gain isn’t from IR "heating water to depth"—it’s from surface absorption + physical mixing. 2. How CO₂ Warms the Ocean (Indirectly) CO₂ traps heat in the atmosphere, warming the air. This warm air then: Heats the ocean surface via contact (like a stove heating a pot of water). Reduces heat loss from the ocean (by slowing radiative cooling). Example: Over 90% of excess heat from global warming is stored in the ocean (IPCC), and this heat is measured down to 2000+ meters via ARGO floats. 3. Declining Carbon Sink Efficiency The original claim noted that oceans are less efficient at absorbing CO₂ over time. This is due to: Warmer water holds less CO₂ (Henry’s Law). Slowing circulation (e.g., weakened AMOC) reduces vertical mixing, trapping CO₂ near the surface. Biological limits: Phytoplankton can’t keep up with rising CO₂. This is unrelated to IR penetration—it’s about physical/chemical processes. 4. Observed Evidence of Deep Ocean Warming Data from ARGO floats shows heat penetrating hundreds to thousands of meters, debunking the "only surface heats" myth. Thermal expansion (from deep warming) is the #1 driver of sea-level rise—not meltwater. Why This Matters The argument confuses radiation physics (IR absorption) with fluid dynamics (how heat moves in water). The ocean warms because the atmosphere warms first, not because IR penetrates deeply. Bottom line: The IPCC’s statement stands. Oceans absorb heat via mixing, not IR, and their carbon uptake is slowing—both are well-documented. |
|
Title: Re: Emissions Higher Under Albanese Than Morrison Post by Ai_Took_Our_Jobs on May 31st, 2025 at 5:26pm Quote:
You're correct that the Clausius-Clapeyron (C-C) equation governs the relationship between temperature and water vapour capacity, but your objection ("it may or may not hold more water") misinterprets how this plays out in Earth's climate system. Here’s the breakdown: 1. What the Clausius-Clapeyron Equation Actually Says The C-C equation describes the exponential increase in saturation vapour pressure (maximum possible water vapour) with temperature: (below) Key takeaway: For every 1°C warming, the atmosphere’s water-holding capacity increases by ~7% (assuming constant relative humidity). 2. Why "It May or May Not Hold More Water" Is Misleading Your objection suggests uncertainty, but in reality: Relative humidity (RH) is roughly stable globally (observed over decades). This means as temperature ( T T) rises, absolute humidity (actual water vapour content) increases proportionally to the C-C relationship. Exceptions exist locally (e.g., over deserts or sinking air regions), but globally, observations confirm a net increase in atmospheric water vapour (~4% more since the 1970s, matching warming trends). Observed Evidence: Satellite data (e.g., AIRS, ERA5) shows increasing total column water vapour over oceans and moist regions. IPCC AR6: "It is virtually certain that global mean tropospheric water vapour has increased since the 1970s." 3. Why Water Vapour Feedback Is Strong and Positive The original statement called water vapour the "strongest GHG amplifier" because: Warmer air → more water vapour (per C-C). Water vapour is a potent greenhouse gas (traps outgoing longwave radiation). This traps more heat → further warming → more evaporation (a self-reinforcing cycle). Why Negative Feedback Is Rare: Your "may not" scenario would require large-scale, sustained drops in RH to offset warming. But: Over oceans (71% of Earth’s surface), RH is tightly coupled to temperature. Even over land, feedbacks like increased evaporation from soils/plants typically maintain or increase humidity. 4. Caveats (Where Your Point Has Merit) Upper troposphere: Here, water vapour feedback is debated because: Cold air has low absolute humidity, so warming’s effect is smaller. Some models suggest RH might decrease slightly here (but this is uncertain and offset by lower-altitude increases). Stratosphere: Warming here lowers water vapour (due to tighter cold-trapping), but this is a minor effect. Conclusion: The Original Statement Holds While the C-C equation depends on variables , real-world observations confirm that warming does increase atmospheric water vapour globally, creating a strong positive feedback. Your objection applies only in niche scenarios (e.g., subsiding air over deserts), not the climate system as a whole. Bottom line: Water vapour feedback is robust—and the primary reason climate sensitivity to CO₂ is high (~3°C per doubling). Screen_Shot_2025-05-31_at_4_52_50_pm.png (59 KB | 6
) |
|
Title: Re: Emissions Higher Under Albanese Than Morrison Post by Ai_Took_Our_Jobs on May 31st, 2025 at 5:31pm Quote:
You're correct that the jet stream has been studied since the 19th century, but your dismissal ("Rubbish") ignores the observed changes in its behaviour due to Arctic amplification. Here’s why the original statement holds up to scrutiny: 1. Yes, the Jet Stream Has Always Wavered—But Not Like This Historical context: The jet stream’s meandering (Rossby waves) was indeed documented early (e.g., by Dove in the 1830s). However, recent research shows increased "stalling" and amplification of these waves due to: Reduced Arctic-sea-ice: Less reflectivity → more heat absorption → weaker pole-to-equator temperature gradient. Slower jet stream: Studies (e.g., Francis & Vavrus, 2012) found a ~10% slowdown in summer since 1979, linked to Arctic warming. Key distinction: Natural variability ≠ anthropogenic forcing. The jet stream’s baseline behaviour is now shifting due to human-caused climate change. 2. Observed Links to Extreme Weather Your Metcheck link shows jet stream archives, but it doesn’t address changes in persistence. Modern research connects jet-stream weakening to: 2021 Texas freeze: A stretched polar vortex (due to weak jet stream) allowed Arctic air to plunge south. 2010 Russian heatwave/2013 European floods: Blocking patterns (stationary Rossby waves) lasted weeks, not days. Increased "stuck" weather: A 2018 Nature Communications study found slower-moving summer jet streams correlate with extreme events. Data vs. Anecdote: Reanalysis data (ERA5, NOAA) confirms increased wave amplitude post-2000s. Models predicted this: IPCC AR6 notes "high confidence" in Arctic influence on mid-latitude circulation. 3. The "Verify Your AI Model" Red Herring The original claim isn’t from an "AI model"—it’s from peer-reviewed science: Satellite era: Jet-stream trends are measurable since 1979 (NASA, ECMWF). Paleoclimate proxies: Ice cores/sediments show current Arctic warming is unprecedented in >100k years, ruling out natural cycles as the driver. Why your objection fails: Archival jet-stream maps (like Metcheck’s) don’t disprove trends—they lack quantitative analysis of wave speed/amplitude changes. Correlation ≠ causation, but when physics (Arctic amplification) + observations (slower waves) + models all align, the link is robust. 4. The Bigger Picture The jet stream is like a river: Normal: Fast-flowing, small meanders (stable weather). Now: Slower, bigger meanders (prolonged extremes). This isn’t "rubbish"—it’s empirical climatology. Bottom line: Your rebuttal conflates "known behaviour" with "unchanged behaviour." The science shows Arctic warming is loading the dice for slower, wavier jet streams—and extreme weather. |
|
Title: Re: Emissions Higher Under Albanese Than Morrison Post by lee on May 31st, 2025 at 5:42pm Ai_Took_Our_Jobs wrote on May 31st, 2025 at 5:26pm:
Oh? Just over the oceans and moist regions. You mean there is no global increase? How odd. ;D ;D ;D ;D Ai_Took_Our_Jobs wrote on May 31st, 2025 at 5:26pm:
Yes it is. It is the dominant GHG. That means CO2 only plays a bit part, if at all. Thanks for that. ;) Ai_Took_Our_Jobs wrote on May 31st, 2025 at 5:26pm:
But then you are ignoring increased CO2 reduces the stomata of plants so they don't lose as much by evaporation. ;) Ai_Took_Our_Jobs wrote on May 31st, 2025 at 5:26pm:
And? Ai_Took_Our_Jobs wrote on May 31st, 2025 at 5:26pm:
So you are sayingthe Cluusius-Clapeyron equation doesn't necessarily hold true. ;) Ai_Took_Our_Jobs wrote on May 31st, 2025 at 5:26pm:
No, the water feedback is strong which reduces the effect of CO2. ;D ;D ;D https://friendsofscience.org/assets/documents/TPW-and-GHE.pdf |
|
Title: Re: Emissions Higher Under Albanese Than Morrison Post by John Smith on May 31st, 2025 at 5:42pm
looks like Lee has been schooled :D
|
|
Title: Re: Emissions Higher Under Albanese Than Morrison Post by lee on May 31st, 2025 at 5:47pm
Oh Guido. You are so funny. ;D ;D ;D ;D ;D
|
|
Title: Re: Emissions Higher Under Albanese Than Morrison Post by lee on May 31st, 2025 at 5:56pm Ai_Took_Our_Jobs wrote on May 31st, 2025 at 5:31pm:
So it never happened in the past? Oh dear. Most models only go back as far as about 1979. "A multi-century climate record suggests that current Atlantic jet-stream variations are not the cause of an increase in extreme weather events. " https://www.nature.com/articles/d41586-025-00871-0 |
|
Title: Re: Emissions Higher Under Albanese Than Morrison Post by lee on May 31st, 2025 at 6:37pm
Read up on the Great Blizzard of 1888. The jet stream existed, although jets didn't, so it wasn't called that. ;)
|
|
Title: Re: Emissions Higher Under Albanese Than Morrison Post by John Smith on May 31st, 2025 at 6:39pm lee wrote on May 31st, 2025 at 5:47pm:
and you are soooo stupid! |
|
Title: Re: Emissions Higher Under Albanese Than Morrison Post by Gnads on Jun 1st, 2025 at 10:30am John Smith wrote on May 31st, 2025 at 5:42pm:
How would you know? ;D |
|
Title: Re: Emissions Higher Under Albanese Than Morrison Post by lee on Jun 1st, 2025 at 12:04pm Gnads wrote on Jun 1st, 2025 at 10:30am:
Because he believes Ai's response, little realising Ai is using Ai generated text, even though he no longer admits it. He doesn't know that isn't knowledge, it is merely parroting. ;) |
|
Australian Politics Forum » Powered by YaBB 2.5.2! YaBB Forum Software © 2000-2026. All Rights Reserved. |