Jovial Monk wrote on Dec 18th, 2024 at 7:23pm:Another post that could have been made in the [NotThe]Environment board BUT the little puke has me banned for a bullshit reason.
Quote:Farming has always been gambling with dirt but the odds are getting longer
Rainfall patterns are changing, crops are ripening earlier and the normal rhythms of farming have fallen off exactly as climate scientists warned |
|
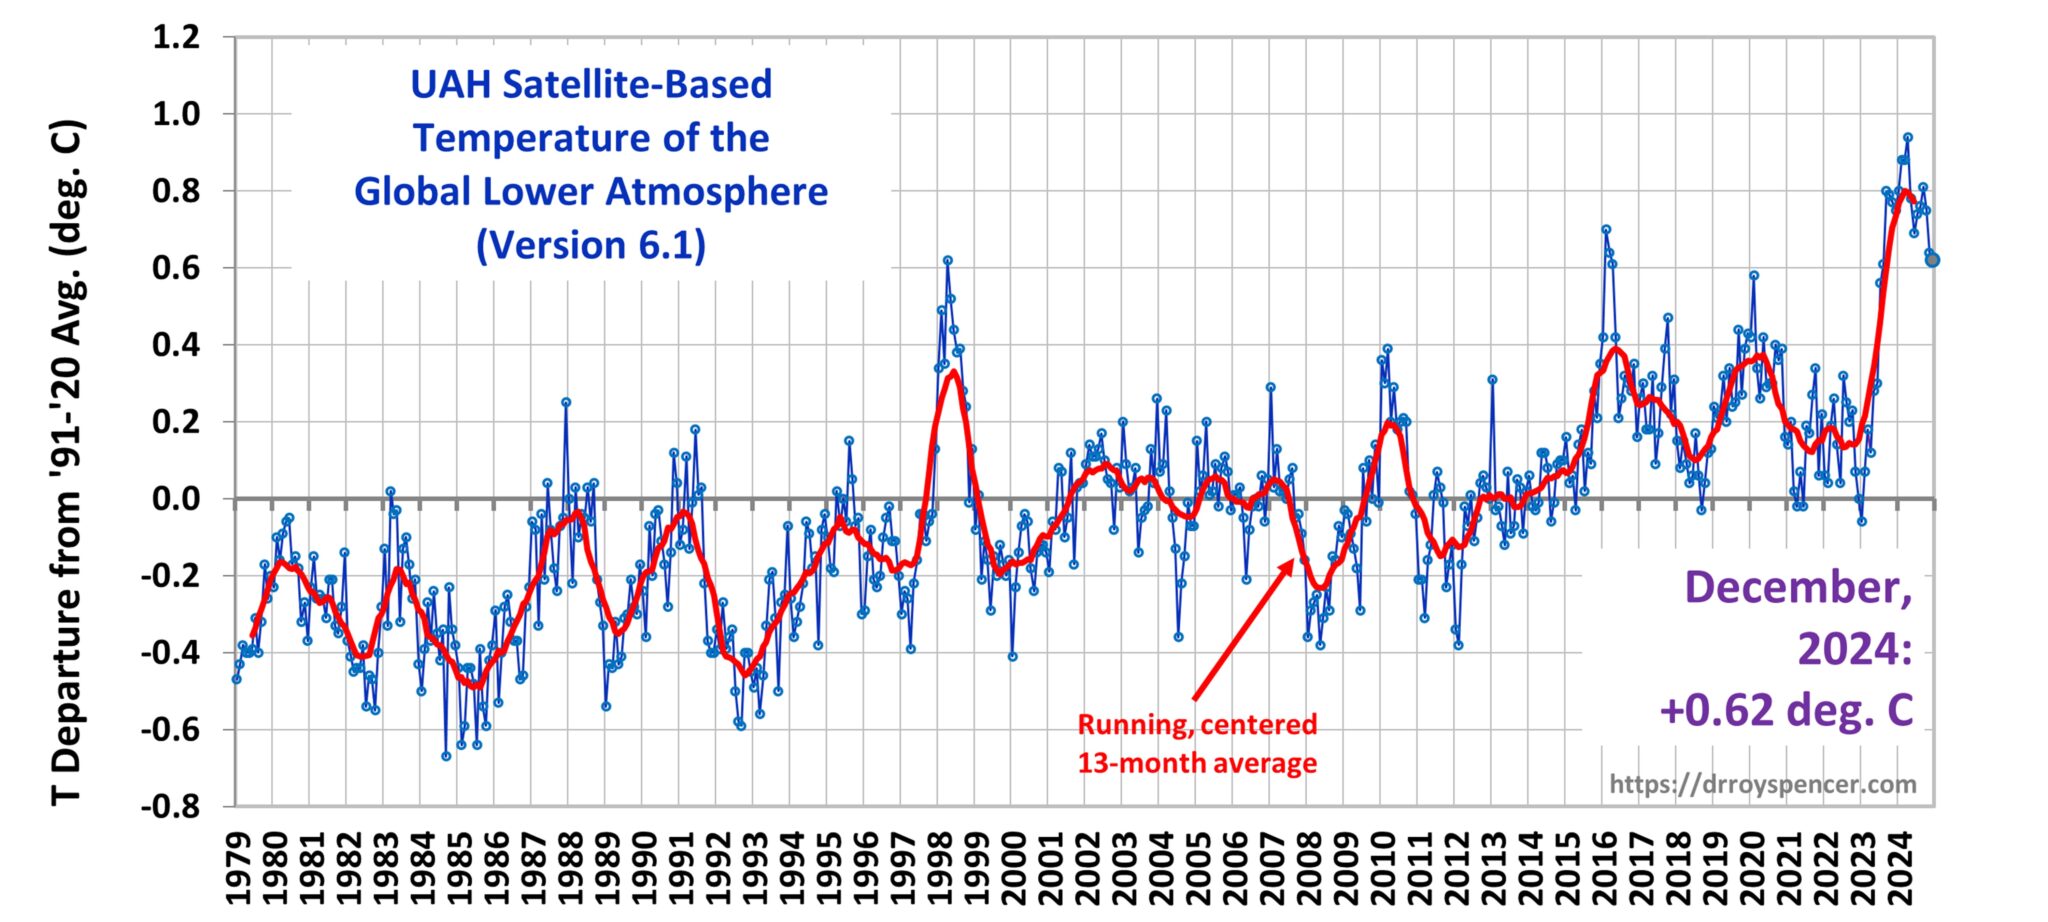
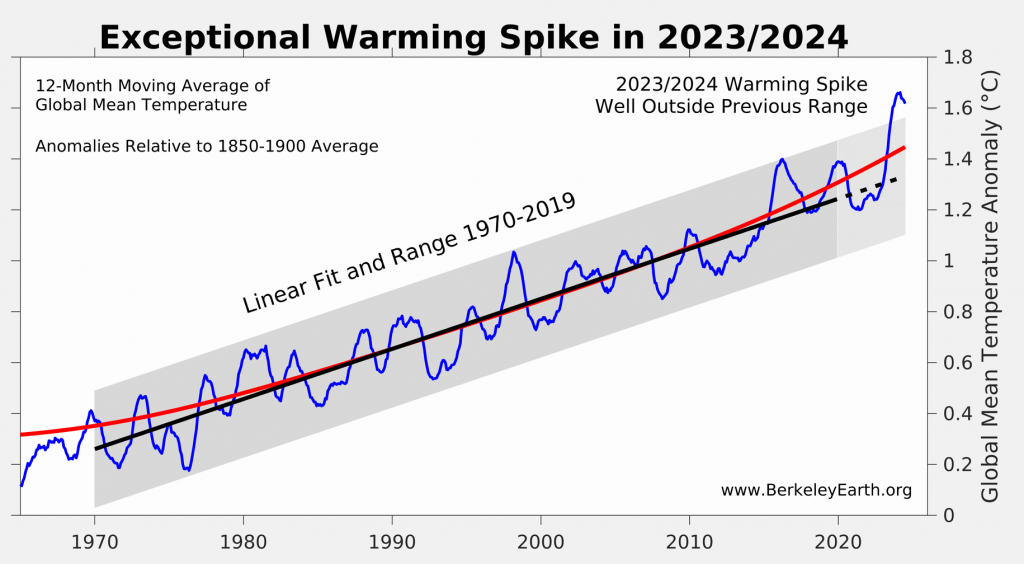
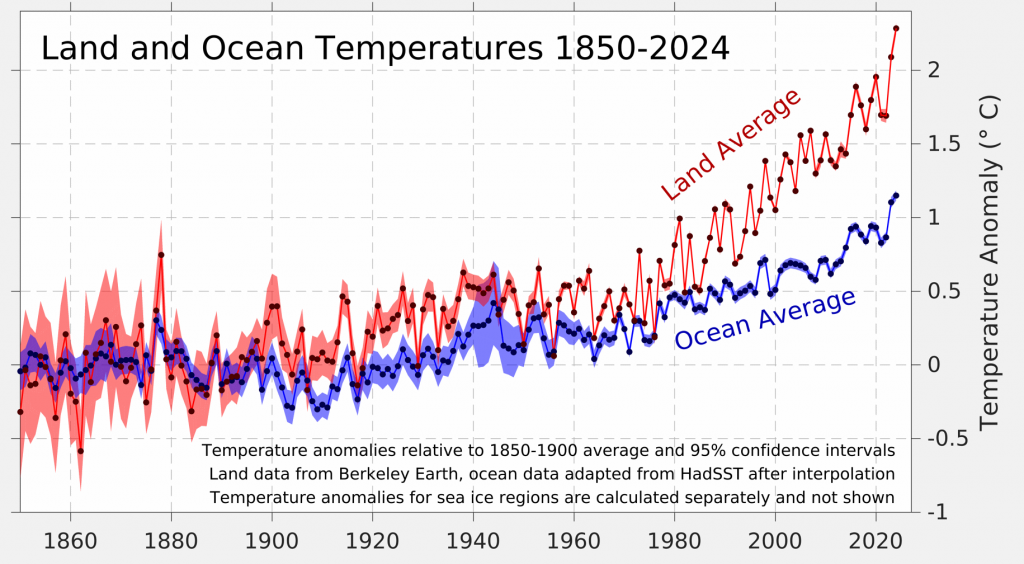
The BoM/CSIRO State of the Climate 2024 Report echoes this. Southern Australis is drying, northern Australia is getting wetter. And this year is the hottest year on record.
[quote]In the last 30 years though, summer has meant harvest and the battle to get the crop off in a reasonable state for the best possible price. It has meant never knowing whether the wheat would be in the bin before Christmas Day.
It used to be a fairly good rule of thumb that the canola was ready in the last week of November and the wheat was ready to strip in the first week of December. Life is not without hurdles and ours always include summer storms, machinery breakdowns and labour challenges, but those dates were fairly constant.
Over the years, the crops have ripened faster. This year, the canola was early and even the wheat was ready in November. That early start was interrupted by some of the biggest rainfalls of 2024, close to 110mm or more than four inches in the old money falling in a week. |
|
The lower the rainfall is in a region the more irregular rainfall becomeslonger dry stretches, fiercer downpours. I learned this in third year high school, guess the little puke ruining Environment dropped out before learning that, not that he ever learned much.
Quote:| I had pegged 2024 as a dry year but, after adding up the rainfall, it turns out the annual fall was pretty close to the average for this district. It just fell in summer more than winter and in greater extremes, a bit like climate scientists had predicted. |
|
Wheat, canola etc are not grown in summer.
"Key statistics
369 million hectares of agricultural land, down 5% from 2020-21
36 million tonnes of wheat produced, up 14%
7 million tonnes of canola production, up 43%
70 million sheep and lambs on farms at 30 June 2022, up 3%
22 million beef cattle at 30 June 2022, up 1%
https://www.abs.gov.au/statistics/industry/agriculture/agricultural-commodities-australia/latest-release
Quote:I dont mean to be glib but this year has been mostly hotter and wetter except where it has been drier, according to the Bureau of Meteorology.
We started with an El Niño declared from September 2023 which caused a stampede of stock headed for the saleyards at a lower price as the summer approached. Prepare for drought, they cried.
I was one of them. There is nothing worse than feeding animals through a drought. And certainly south-western Victoria is in trouble with drought, as is South Australia. Elsewhere, it rained. And rained. There were floods throughout the country, including in parts of Western Australia which received half a years rainfall in 24 hours.
I had to laugh at the rather guarded wisdom from Seth Westra, a professor of hydrology and climate risk at the University of Adelaide.
If you follow the advice, on average, youll probably be ahead, he told the Rural Network in January. But therell be times when youre not. Thats where trying to hedge against different eventualities is really the way to manage. |
|
Heads I win, tails you lose.
Quote:The dry weather amped up the protein in crops like wheat, enough to make the most sluggish sourdough bloom. Apparently, there was a silver lining on those dry skies. Higher protein wheat means a high price for the farmer.
Then, late in our harvest, that aforementioned rain fell. A wet crop cannot be harvested until it dries out. It also often loses quality, and therefore price premium, fast.
Modern cropping requires big investments in seed, fertiliser, sprays and labour. Those costs have been rising as farmers have pushed for greater production, to boost incomes and stay ahead of the climate change. |
|
That big investment is why ruzzians will be hungry next year.
[quote]Throwing a high investment at raising a food crop becomes an even riskier venture in an ever-more unpredictable climate. If you win the bet, you can win big. If you lose, not only do you forgo a potential income, but you have lost the money already spent.
While more than half of Australias landmass is managed by farmers, most of that is used for grazing because much of the country is not suitable for cropping. Only one-fifth of Australian farms are classified as broadacre cropping farms. At the same time, there is rising demand for protein around the world.
Though the total number of farm businesses has been falling across all enterprises over the longer term, it is no surprise that the number of specialist beef producers increased in all states except South Australia and the Northern Territory.
https://www.theguardian.com/australia-news/2024/dec/17/farming-has-always-been-gambling-with-dirt-but-the-odds-are-getting-longerSo the Guardian can't do simple research. Who knew? That's what comes of not going to data.
Poor JM the Guardians true friend. ;D ;D ;D ;D ;D