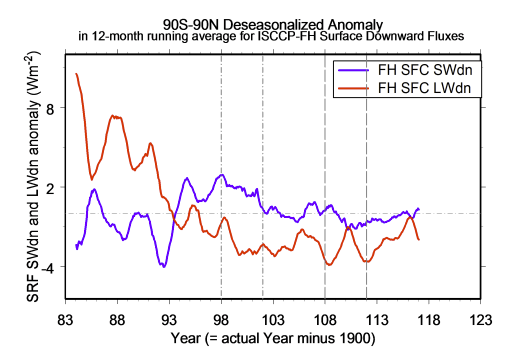
In February 2023 a new study was published measuring what is colloquially called the “greenhouse effect” even though the actual mechanics involved are quite unlike covering a growing space with a thin exterior glass wall. The paper (journal article here, non paywalled version here, h/t NoTricksZone) used satellite data covering 1983 to 2020, during which we all know that greenhouse gases went way up in the atmosphere. And we all know (h/t Al Gore) that they “trap heat” and roast the planet. But how exactly do they “trap heat”? Well, they’re transparent to visible light coming in, hitting the Earth’s surface and warming it, but they then absorb long wave or infrared radiation coming back from the warmer ground and re-radiate it in every direction including, for some of it, back downwards, which further warms the surface. (We have a backgrounder in which a physicist explains the process in detail here.) So it stands to reason that as greenhouse gas levels go up, since they are supposedly the control knob on the climate, the amount of downward or “downwelling” longwave radiation should be going up too. Should. According to the theory. But according to the data, ain’t. It’s going down. And some of us still care more about what the facts are than what the models say they ought to be.
The data series is the red line in this graph (LWdn is terrestrial longwave downwelling radiation, SWdn is solar shortwave downwelling radiation): |
|