| Australian Politics Forum | |
|
http://www.ozpolitic.com/forum/YaBB.pl
Member Run Boards >> Environment >> BoM Automatic Weather Station Review http://www.ozpolitic.com/forum/YaBB.pl?num=1505189575 Message started by lee on Sep 12th, 2017 at 2:12pm |
|
|
Title: BoM Automatic Weather Station Review Post by lee on Sep 12th, 2017 at 2:12pm
BoM has released its report on AWS.
Despite earlier saying there was no problem with Goulburn, that it was just a manual check of the system, and then later Thredbo - "The Panel was commissioned to evaluate the integrity of the AWS network following equipment failures in Goulburn and Thredbo which caused the loss of some temperature data below minus 10.4 degrees celsius. The Review's findings support the Bureau's initial investigations that outages at temperatures below minus 10.4 degrees at both locations were the result of equipment in those locations not being fit for purpose. There were outages at below minus 10.4 degrees on one day in Goulburn and on six days in Thredbo." Thredbo has since had a minimum of 10.9 degrees. But the instruments are capable of reading to -60 degrees. It would seem the IMSI1 card reader prevented any reading below -10, which would be a setup parameter. Thredbo has a record low of -14.7 degrees in 1980. https://www.spectator.com.au/2017/09/not-really-fit-for-purpose-the-bureau-of-meteorology/ "Notwithstanding the soundness of the Bureau's data quality control, there were clearly failures in some of the Bureau's internal processes dating back to the mid-1990s that allowed equipment that was not fit for purpose to be installed at a small number of locations. Inadequate process, documentation and communication meant that some field officers were unaware of the different capabilities of similar pieces of equipment." http://www.bom.gov.au/inside/Review_of_Bureau_of_Meteorology_Automatic_Weather_Stations.pdf |
|
Title: Re: BoM Automatic Weather Station Review Post by Grendel on Sep 19th, 2017 at 8:45am
They're at it again. ABC reported this morning we've had the hottest driest Winter on record by 2 degrees.
Really. I was thinking it was pretty cold down here. The snow season has been extended. We had record rainfalls. So where does BOM get it readings from? Not where I live obviously. |
|
Title: Re: BoM Automatic Weather Station Review Post by Grendel on Sep 19th, 2017 at 8:49am
Smoking gun demands grilling for Bureau of Meteorology
Enough is enough. The Bureau of Meteorology yet again stands charged with fabricating temperature records. This time, thanks to the diligence of scientist Jennifer Marohasy, the bureau has been caught red-handed regulating temperatures to keep them above a predetermined minimum — at least for two NSW automatic weather stations, one located in Goulburn, the other at Thredbo. The BOM initially admitted it had set an arbitrary limit of minus 10C for the Goulburn station, but then changed the story to the equipment being “not fit for purpose” — because it got too cold — even though the same instruments are used in the Antarctic. The actual temperature measured was a record July low for Goulburn, at minus 10.4C, so why, if the equipment was faulty, didn’t the bureau leave a blank instead of rounding up to minus 10C? Allowing the bureau to defend itself, Environment Minister Josh Frydenberg called for an internal review. In 77 pages, it acknowledged that, indeed, Goulburn and Thredbo were governed and, minimum limits were set. This was blamed on a filter being installed into these weather stations 15 and 10 years ago respectively. No limits were imposed on maximum temperatures. Yet implicitly, we are asked to believe that the historical temperature record has not been compromised. Before filters were installed, Goulburn recorded minus 10.9C in August 1994 and, in that cold winter, Thredbo went down to minus 13.6C and nearby Charlotte Pass to minus 23C on June 29, a record low for Australia. Charlotte Pass weather station was decommissioned in March 2015. Ironically, the bureau’s newest location, near White Cliffs in NSW, home to some of the nation’s hottest temperatures, last August recorded minus 62.5C, due to a “hardware fault”. A BOM-friendly technical forum, part of former minister Greg Hunt’s plan to buy time and “kill off” a proposed Abbott government probe, has foreshadowed “the need for a major revision of the dataset”. Predictably, though, it did not address specific claims by Marohasy and others, and seems satisfied the bureau’s dataset is well maintained. Really? This may fool ministers, but for a sceptical public, time has run out. British author and journalist Christopher Booker says: “When future generations look back on the global warming scare of the past 30 years, nothing will shock them more than the extent to which the official temperature records — on which the entire (global warming) panic ultimately rested — were systematically ‘adjusted’ to show the Earth as having warmed much more than the actual data justified.” He says this practice has been observed by experts around the world and “raises an ever larger question mark over the entire official surface temperature record”. He is joined by John Theon, retired chief of NASA’s Climate Processes Research Program and responsible for all weather and climate research, who testified before congress that “some scientists have manipulated the observed data to justify their model results. In doing so, they neither explain what they have modified in the observations, nor explain how they did it.” Take the article NASA published in 1999 showing 1934 was the US’s warmest year. Across the ensuing decade, by cooling the past and warming the present, 1998 jumped five places to become the warmest. Whistleblower John Bates, recently retired principal scientist at US National Oceanic and Atmospheric Administration, described how his agency manipulated data to manufacture a non-existent increase in global temperatures. Why should Australia be any different? We remember the Climategate emails from despairing programmer Ian Harris: “Getting seriously fed up with the state of the Australian data, so many new stations have been introduced, so many false references”. Science writer and blogger Joanne Nova has raised scandal after scandal concerning the BOM’s record-keeping. She refers to historic data being destroyed, and the influence of adjustments on Australia’s warming trend. She reports private auditors advising the bureau of almost a “thousand days where minimum temperatures were higher than the maxes”. Taxpayers outlaying $1 million a day for reliable temperature data deserve better than this. When Australia’s bureau transitioned from mercury thermometers to electronic sensors more than 20 years ago, to ensure readings from these devices were comparable with the old thermometers and complied with World Meteorological Organisation guidelines, parallel studies were undertaken at multiple sites. A key conclusion was that readings from the new electronic sensors needed to be averaged over one to 10 minutes. However, rather than implement practices consistent with their finding, the bureau records one-second extremes (or noise), which can be announced as new record highs. Inherent inconsistency aside, this calls into question whether Australian data is WMO compliant. Marohasy discovered this as part of her investigation and believes it is more damning than even the imposition of minimum limits, as it affects the recording of temperatures from all 695 automatic stations. pt1 |
|
Title: Re: BoM Automatic Weather Station Review Post by Grendel on Sep 19th, 2017 at 8:50am
pt2
Marohasy is a respected scientist, known for her forensic work. While attempts will be made to dismiss her evidence as an arcane academic skirmish over recording methodology, it is a smoking gun that threatens the integrity of global temperature records. It affects every Australian. It strikes at the heart of renewable energy policies. Globally, trillions of taxpayer dollars are at stake. The government has a duty to inform the Intergovernmental Panel on Climate Change, should it have sufficient grounds, that the bureau is not complying with WMO guidelines. Sooner or later, closed eyes must open. Now, with Marohasy’s evidence adding to the credible findings of other experts, there can be no confidence in any future official assurances. Further delay of a proper independent audit, which includes dissidents, can be interpreted only as a cover-up. One way or another, the truth will out. Oh dear more proof that Monkeyboy was stiffed by the so called experts he believed in. Ridiculing people like Nova and Marohasy who have been proved right. :) |
|
Title: Re: BoM Automatic Weather Station Review Post by JaSinner on Sep 19th, 2017 at 12:42pm
On TV this morning: 'Clean' Coal energy is only a 20% improvement. But Coal in essence, is a pollutant.
|
|
Title: Re: BoM Automatic Weather Station Review Post by lee on Sep 19th, 2017 at 3:46pm Jasin wrote on Sep 19th, 2017 at 12:42pm:
Which pollutants? |
|
Title: Re: BoM Automatic Weather Station Review Post by Grendel on Sep 19th, 2017 at 9:13pm
Coal is a pollutant?
Really? Don't you mean CO2? LOL... Tell it to the plants. ;D |
|
Title: Re: BoM Automatic Weather Station Review Post by The_Barnacle on Sep 20th, 2017 at 9:49pm Grendel wrote on Sep 19th, 2017 at 8:45am:
You do realize that Australian alpine areas make up less than 1% of the total Australian land area and that generally speaking it snows there every winter. record rainfails? Not according to the real statistics. Barely any places even had above average rainfall over winter http://www.bom.gov.au/jsp/awap/rain/index.jsp?colour=colour&time=latest&step=0&map=anomaly&period=3month&area=nat But you deniers enjoy making things up and hoping that you won't be caught out telling lies. I caught out Longweekend telling similar lies |
|
Title: Re: BoM Automatic Weather Station Review Post by lee on Sep 20th, 2017 at 10:13pm The_Barnacle wrote on Sep 20th, 2017 at 9:49pm:
"The rainfall analyses and associated maps use data contained in the Bureau of Meteorology climate database, the Australian Data Archive for Meteorology (ADAM). The analyses are initially produced automatically from real-time data with limited quality control. They are intended to provide a general overview of rainfall across Australia as quickly as possible after the observations are received." "The analyses are computer generated using a sophisticated analysis technique described in Jones et al. (2009). This method uses an optimised Barnes successive correction technique that applies a weighted averaging process to the station data. Topographical information is included by the use of rainfall ratio (actual rainfall divided by monthly average) in the analysis process. On the maps each gridpoint represents an approximately square area with sides of about 5 kilometres (0.05 degrees). The size of the grids is limited by the data density across Australia. This gridpoint analysis technique provides an objective average for each grid square and enables useful estimates in data-sparse areas such as central Australia. " http://www.bom.gov.au/climate/austmaps/about-rain-maps.shtml So let's see weighted averages to station data. What could possibly go wrong? Useful estimates in data sparse areas. Like the gap between Alice Springs and Katherine? Alice Springs and Newman or Leonora? Why don't they just admit to Wild Arse Guesses? |
|
Title: Re: BoM Automatic Weather Station Review Post by Grendel on Sep 20th, 2017 at 10:32pm The_Barnacle wrote on Sep 20th, 2017 at 9:49pm:
Well I'm not lying YOU are. I said we had record rainfalls... we did where I live. Record snow falls as I stated too... You should pull your head in a grow a brain it might improve your understanding as a denier and liar. |
|
Title: Re: BoM Automatic Weather Station Review Post by Sir Bobby on Sep 20th, 2017 at 10:45pm
Thanks Grendel,
I always thought we were being lied to. |
|
Title: Re: BoM Automatic Weather Station Review Post by lee on Sep 22nd, 2017 at 11:30am The_Barnacle wrote on Sep 20th, 2017 at 9:49pm:
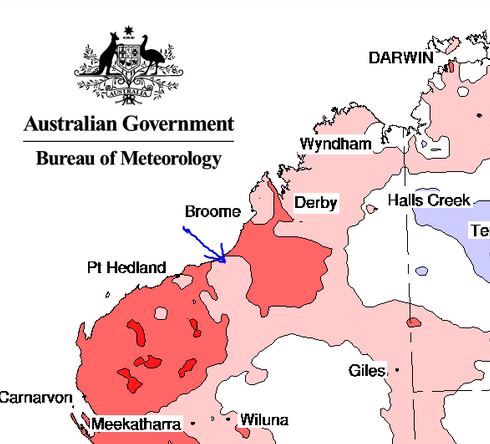
Remember this? it links to a map. Now have a look at the decile range - http://www.bom.gov.au/web03/ncc/www/awap/rainfall/decile/3month/colour/latest.hres.gif Here is a slightly different version showing Mandora in WA. Why is that interesting? Because Mandora is in the Pilbara and often doesn't get winter rainfall - AT ALL. The data- http://www.bom.gov.au/jsp/ncc/cdio/weatherData/av?p_nccObsCode=139&p_display_type=dataFile&p_startYear=&p_c=&p_stn_num=04019 Now note the scale on the right - "Very Much Below Average". How do you get negative rainfall. You can read the full story here - https://wattsupwiththat.com/2017/09/21/welcome-to-australia-where-its-always-warmer-somewhere/ Written by Dr Bill Johnston - "Former NSW Department of Natural Resources research scientist. Due to his scientific approach to data analysis, Dr Johnston is proud to be banned from commenting on The Conversation’s conversations" |
|
Title: Re: BoM Automatic Weather Station Review Post by The_Barnacle on Sep 24th, 2017 at 11:32am lee wrote on Sep 22nd, 2017 at 11:30am:
;D ;D ;D ;D ;D ;D ;D ;D Oh dear oh dear. It's really quite embarrassing for whatsupwiththat and lee when they can so easily be proven wrong. They are either fraudulently misrepresenting the statistics and hoping that people don't notice or they arn't the sharpest tools in the shed. Here's a project for you lee. Why don't you count how many years Mandora gets winter rainfall from that link you so helpfully provided? I already have. In the 104 years of records they have received at least some winter rainfall on 82 occasions The 2017 winter rainfall was 0.0 This means that it sits in the lower part of the "Below average" decide range Also your map shows the incorrect location for Mandora Station. It is south west of the arrow tip in the pale pink "below average" range. So once again whatsupwiththat and lee get it hopelessly wrong Mandoora_station.JPG (46 KB | 50
) |
|
Title: Re: BoM Automatic Weather Station Review Post by Grendel on Sep 24th, 2017 at 12:11pm
Puhlease.
Weather.... is not climate. Correlation does not Equal Causation. Now run along and read the truth about BOM fudging and lying. And about how the people you support have based their "science" on falsehoods and created models based on the GIGO principle. here's a little reading for you to ignore or deny. http://www.theaustralian.com.au/news/inquirer/western-climate-change-alarmists-wont-admit-they-are-wrong/news-story/892c0088ec01f9186e068f55f2ca6794 |
|
Title: Re: BoM Automatic Weather Station Review Post by The_Barnacle on Sep 24th, 2017 at 12:47pm Grendel wrote on Sep 24th, 2017 at 12:11pm:
What nonsense are you going on about now? whatsupwiththat and lee have been caught out spreading lies to try and discredit the Bureau of Meteorology and I am calling them out on it. Not that the scientists at the BOM really care that a few keyboard warriors think. I'm sure they have a good laugh at the garbage whatsupwiththat posted about Mandora Station |
|
Title: Re: BoM Automatic Weather Station Review Post by lee on Sep 24th, 2017 at 1:51pm The_Barnacle wrote on Sep 24th, 2017 at 11:32am:
You must have missed this bit - Written by Dr Bill Johnston - "Former NSW Department of Natural Resources research scientist So shooting the messenger again. The_Barnacle wrote on Sep 24th, 2017 at 11:32am:
Oh yes average weather. ;) The_Barnacle wrote on Sep 24th, 2017 at 11:32am:
I get BoM's rainfall stats are in groups of 23, 25, 25, 30 years. Average rainfall for those periods are approximately - 28.99, 28.91. 21.51 and 34.56mm. So the average for the last 30 years is 34.56mm and for the base period 1961-1990 is approximately 24.56mm. So on average today's climate is wetter than 1961-1990. ;) The rainfall is simply too random to really worry about averages. One third of winters receive NO rain. |
|
Title: Re: BoM Automatic Weather Station Review Post by The_Barnacle on Sep 24th, 2017 at 2:53pm lee wrote on Sep 24th, 2017 at 1:51pm:
Take responsibility for your posts lee. If you post BS, even if it is somebody elses BS, then you are promoting that BS. lee wrote on Sep 24th, 2017 at 1:51pm:
Another massive diversionary backflip from lee Quote:
The whole point of your original post was trying to discredit the BOM because Mandora "often doesn't get winter rainfall AT ALL" but it turns out that at least 80% of winters it DOES get winter rainfall. You are nothing but a fraud lee |
|
Title: Re: BoM Automatic Weather Station Review Post by lee on Sep 24th, 2017 at 3:17pm The_Barnacle wrote on Sep 24th, 2017 at 2:53pm:
Oh dear poor Barney, who has never made a mistake. And of course that would be if it was a mistake. The_Barnacle wrote on Sep 24th, 2017 at 2:53pm:
Really? You want to compare one year's data against an average? ;D ;D ;D ;D ;D You know where the data shows both more and less rainfall. The_Barnacle wrote on Sep 24th, 2017 at 2:53pm:
Let's see By my count 28% of the time it doesn't get winter rain at all. Now I would consider 28% "often". You may not. |
|
Title: Re: BoM Automatic Weather Station Review Post by Grendel on Sep 24th, 2017 at 3:38pm The_Barnacle wrote on Sep 24th, 2017 at 12:47pm:
The fact you can't understand the simple stuff says alot about you ignoring the truth. Forget what lee said what about the BOM.... oh its ok to rig figures is it? :D :D :D :D :D :D :D :D :D :D |
|
Australian Politics Forum » Powered by YaBB 2.5.2! YaBB Forum Software © 2000-2026. All Rights Reserved. |